Cohort analysis is a type of behaviour analysis that categorizes data into related groups before analysis starts, where the related groups are called cohorts.
The urge for applications to be intelligent in this technology-driven world has become very high. And most of them do not use the data that they collect wisely. So applications track the behaviour of consumers to make future predictions more precisely. This is called Behaviour Analysis, and the resultant data is called Behavioural Analytics.
Behaviour analysis has become an essential part of Business Analytics. It provides fresh information on consumer behaviour on eCommerce platforms, in games, web and mobile applications, and with IoT. The goal of behaviour analysis is to comprehend consumer behaviour and the reasons behind it so that future behaviour can be accurately predicted. All said, how is this related to cohort analysis?
In Cohort Analysis, the cohorts often have similar traits or life experiences within a predetermined time frame. So, instead of slicing across all customers blindly without taking into consideration the natural cycle that a customer experiences, cohort analysis enables a business to "identify trends clearly across the life-cycle of a customer”. An organization can modify and tailor its service to those particular cohorts by observing these patterns over time.
So basically, cohort analysis is a tool to study customer trends and will be very helpful in analyzing the customer data at hand and carefully selecting the useful data that needs to be processed. In the case of monthly subscription app services, cohort analysis can be done to study newly subscribed users and the retention percentage. Like this, many applications can be stated for cohort analysis, the procedure of which shall be discussed briefly in this article.
The Cohort Analysis Procedures
The main purpose of cohort analysis is to simplify the process of analyzing a large amount of consumer data. Appflow.ai, an in-app subscription analytics tool, has a feature for performing cohort analysis for data of humongous quantity at no cost.
Keeping in mind the number of apps that are being deployed daily, cohort analysis for apps has a wide range of applications, as it is a highly efficient method for understanding more about how particular user groups interact with an app over time in the world of mobile apps. It may also be used to improve the KPI (Key Performance Index) when evaluating the success of marketing campaigns.
The procedure for cohort analysis can be broken down into four steps:
1. Choose the query that you want to address:
The goal of the analysis is to produce information that may be used to take immediate action to enhance business, product, user experience, turnover, etc. The appropriate questions must be posed for that to occur. Fixing a definite query and carrying out the necessary steps to solve it will help in smoothing the further process of gathering and analyzing the data for the same.
2. Establish the metrics that will enable you to respond to the query:
Certain factors will be associated with each query. Identification of an event, such as a user checking out, and specified attributes, such as the user's payment amount, payment schedules, and payment methods are some factors which are necessary for thorough cohort analysis. These can be termed as metrics that are related to a particular query and choosing which will ease the difficulty in processing vast quantities of data as it cuts out the unnecessary data which are not associated with the metrics.
3. List the precise cohorts that matter:
To identify and explain user behaviour as a distinct cohort, one must either study all the users and target them or perform attribute contributions to identify the pertinent differences between each of them. The distinctive groups should be listed and cohort analysis should be done on these specific cohorts. A cohort is a collection of people who were born within a specific time frame and share a common trait. So the defined time period plays an important role here.
4. Carry out the cohort analysis:
Bring up the raw data. The information needed to perform cohort analysis typically resides in a database and can be exported into spreadsheet software. Establish cohort identifiers. Open the data that you have downloaded using convenient tools like Excel. Determine the lifecycle stages. The "lifecycle stage" at which each event occurred for each member of the cohort must be identified once we have established the cohort to which each consumer belongs. A pivot table and graph should be made.
With the aid of pivot tables, you can calculate an aggregation across various data dimensions, such as a sum or an average. Depending on your requirements, you can run any one of the many variants of cohort analysis. The spending of each cohort could also be shown as a cumulative value over time in this graph. By doing this, you can create a curve that shows how much each cohort's total lifetime spending has increased over time.
Standardizing this data by cohort size would be much more beneficial. To do this, divide each cohort's data point by the total number of cohort members. In this manner, you can compare the average value for each cohort member side by side without being influenced by the cohort's size. To accomplish this, you must first create a second pivot table to determine the cohort size, and then divide the two by two.
Advantages & Limitations of Cohort Analysis
Businesses can use cohort analysis to focus their analysis and track a particular activity or variable over numerous consumer groups to spot patterns and proactively address issues. Cohort analysis is useful because it makes it easier to distinguish between engagement and growth measures. This is crucial since engagement issues can be easily covered up by expansion.
Like every other application, cohort analysis has its limitations too. It may be necessary for you to devote a lot of time to many different disciplines. They can be time and money-consuming. Resources have to be spent a substantial amount to make this analysis work efficiently. Analytics tools like Appflow.ai provide some basic analytics for free to starters and provide premium tools at affordable rates. And from the user’s perspective, it requires more of their data for analysis.
Automate Cohort Analysis for Subscription Apps
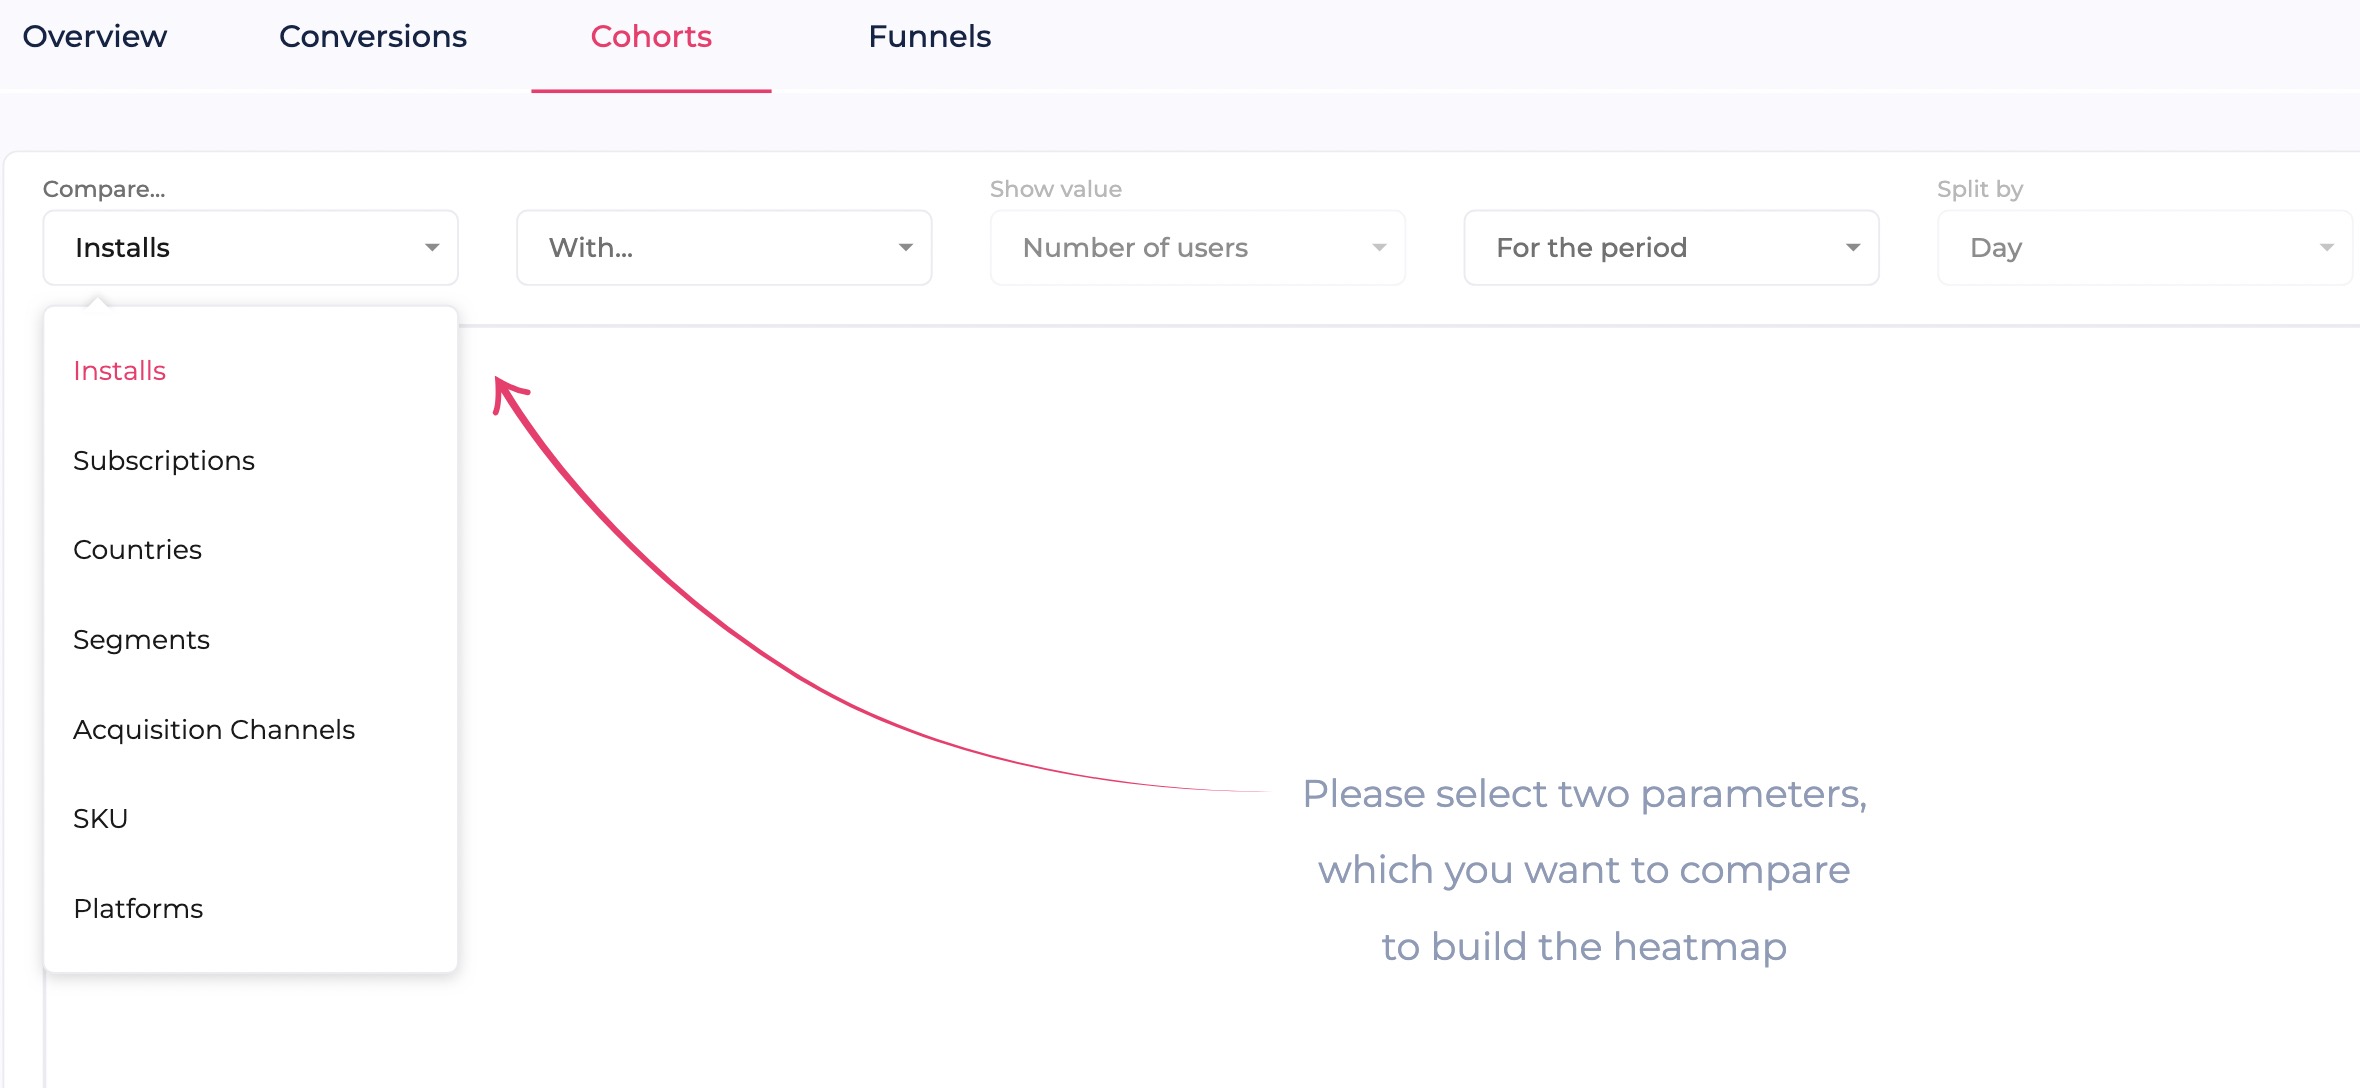
For subscription-based apps, it is much more convenient to use a service to do cohort analysis, in a real-time and higher flexibility manner. Cohorts can be based on various metrics. For example, cohorts available in Appflow.ai includes country, device, acquisition channel, subscription, installation etc. There are actually five types of app cohort analysis.

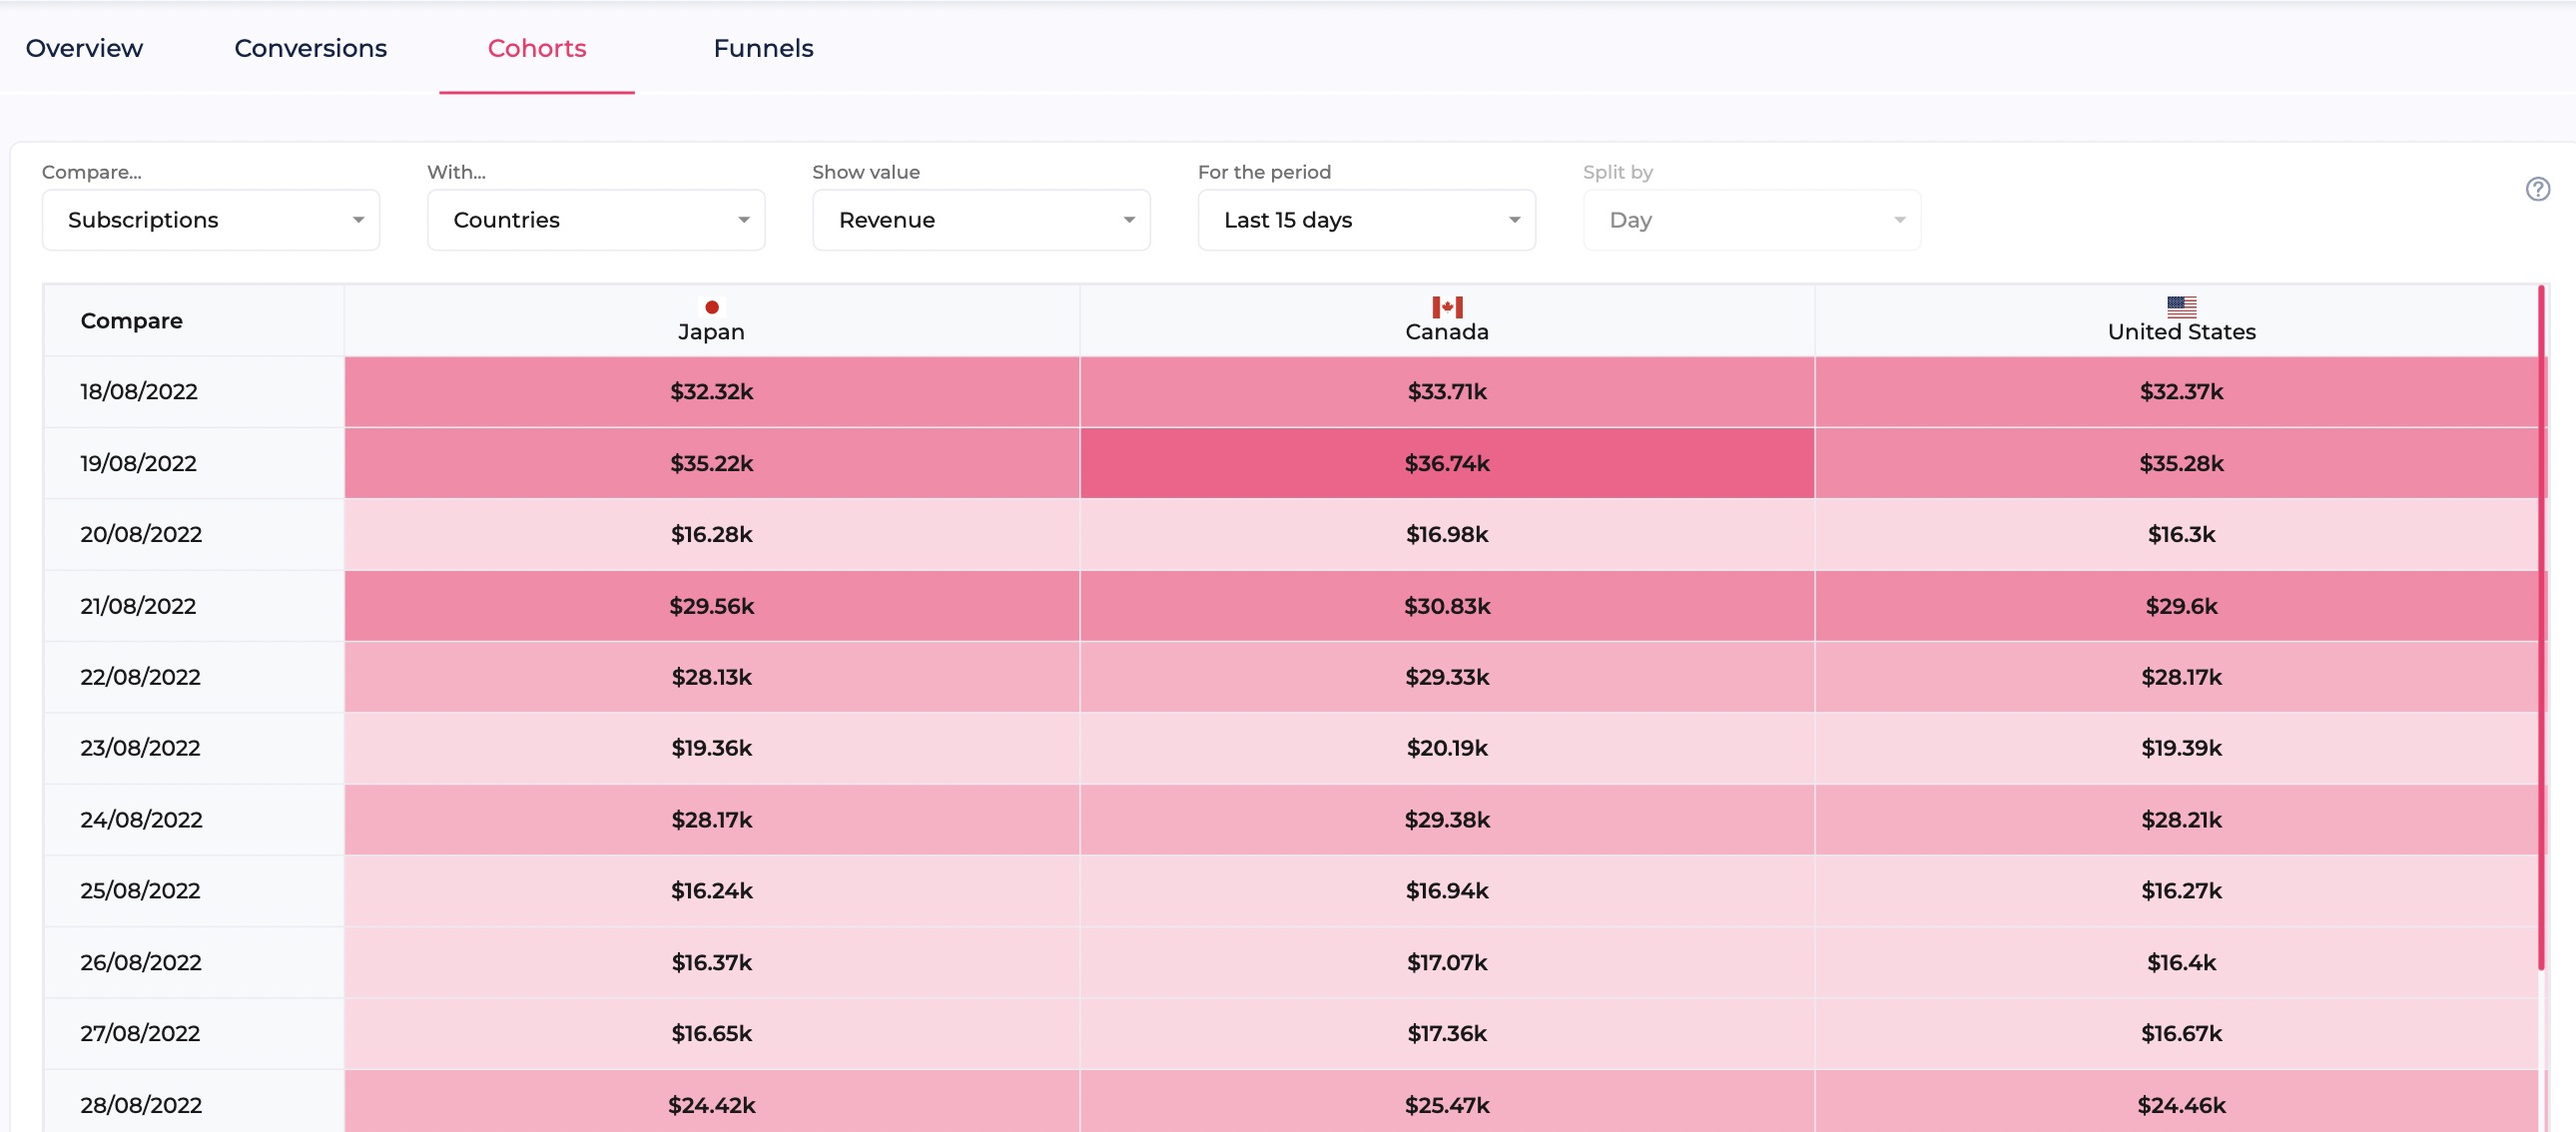
So, if you want to compare subscriptions vs countries, based on revenue, you can just simply choose the metrics from the drop-down menu, and then a visually pleasing table will present you with the analysis outcome as follows:
 You could also compare the subscribers who made additional in-app purchases vs those that did not. This is a perfect way to understand which parts of your product and marketing efforts are providing you with the best results or provide solutions to marketing efforts that have come up short.
Pro tip: Appflow.ai’s cohort analysis is available on Free plan(up to $10K/MTR). Create a free account (no credit card required) and start cohort analysis today!
Conclusion
Cohort analysis is an optimal tool to understand user behaviour and marketing campaign performance. There are various platforms on the internet like Appflow.ai that provide app cohort analysis as a service. Needless to say, cohort analysis can be carried out as a repetitive process. Rinse and repeat when you've effectively enhanced your retention based on one behavioural cohort. The more you try carrying out the process, the more you get adapted to it and also, the more fun it gets.
How to Perform Cohort Analysis for Subscription Apps


